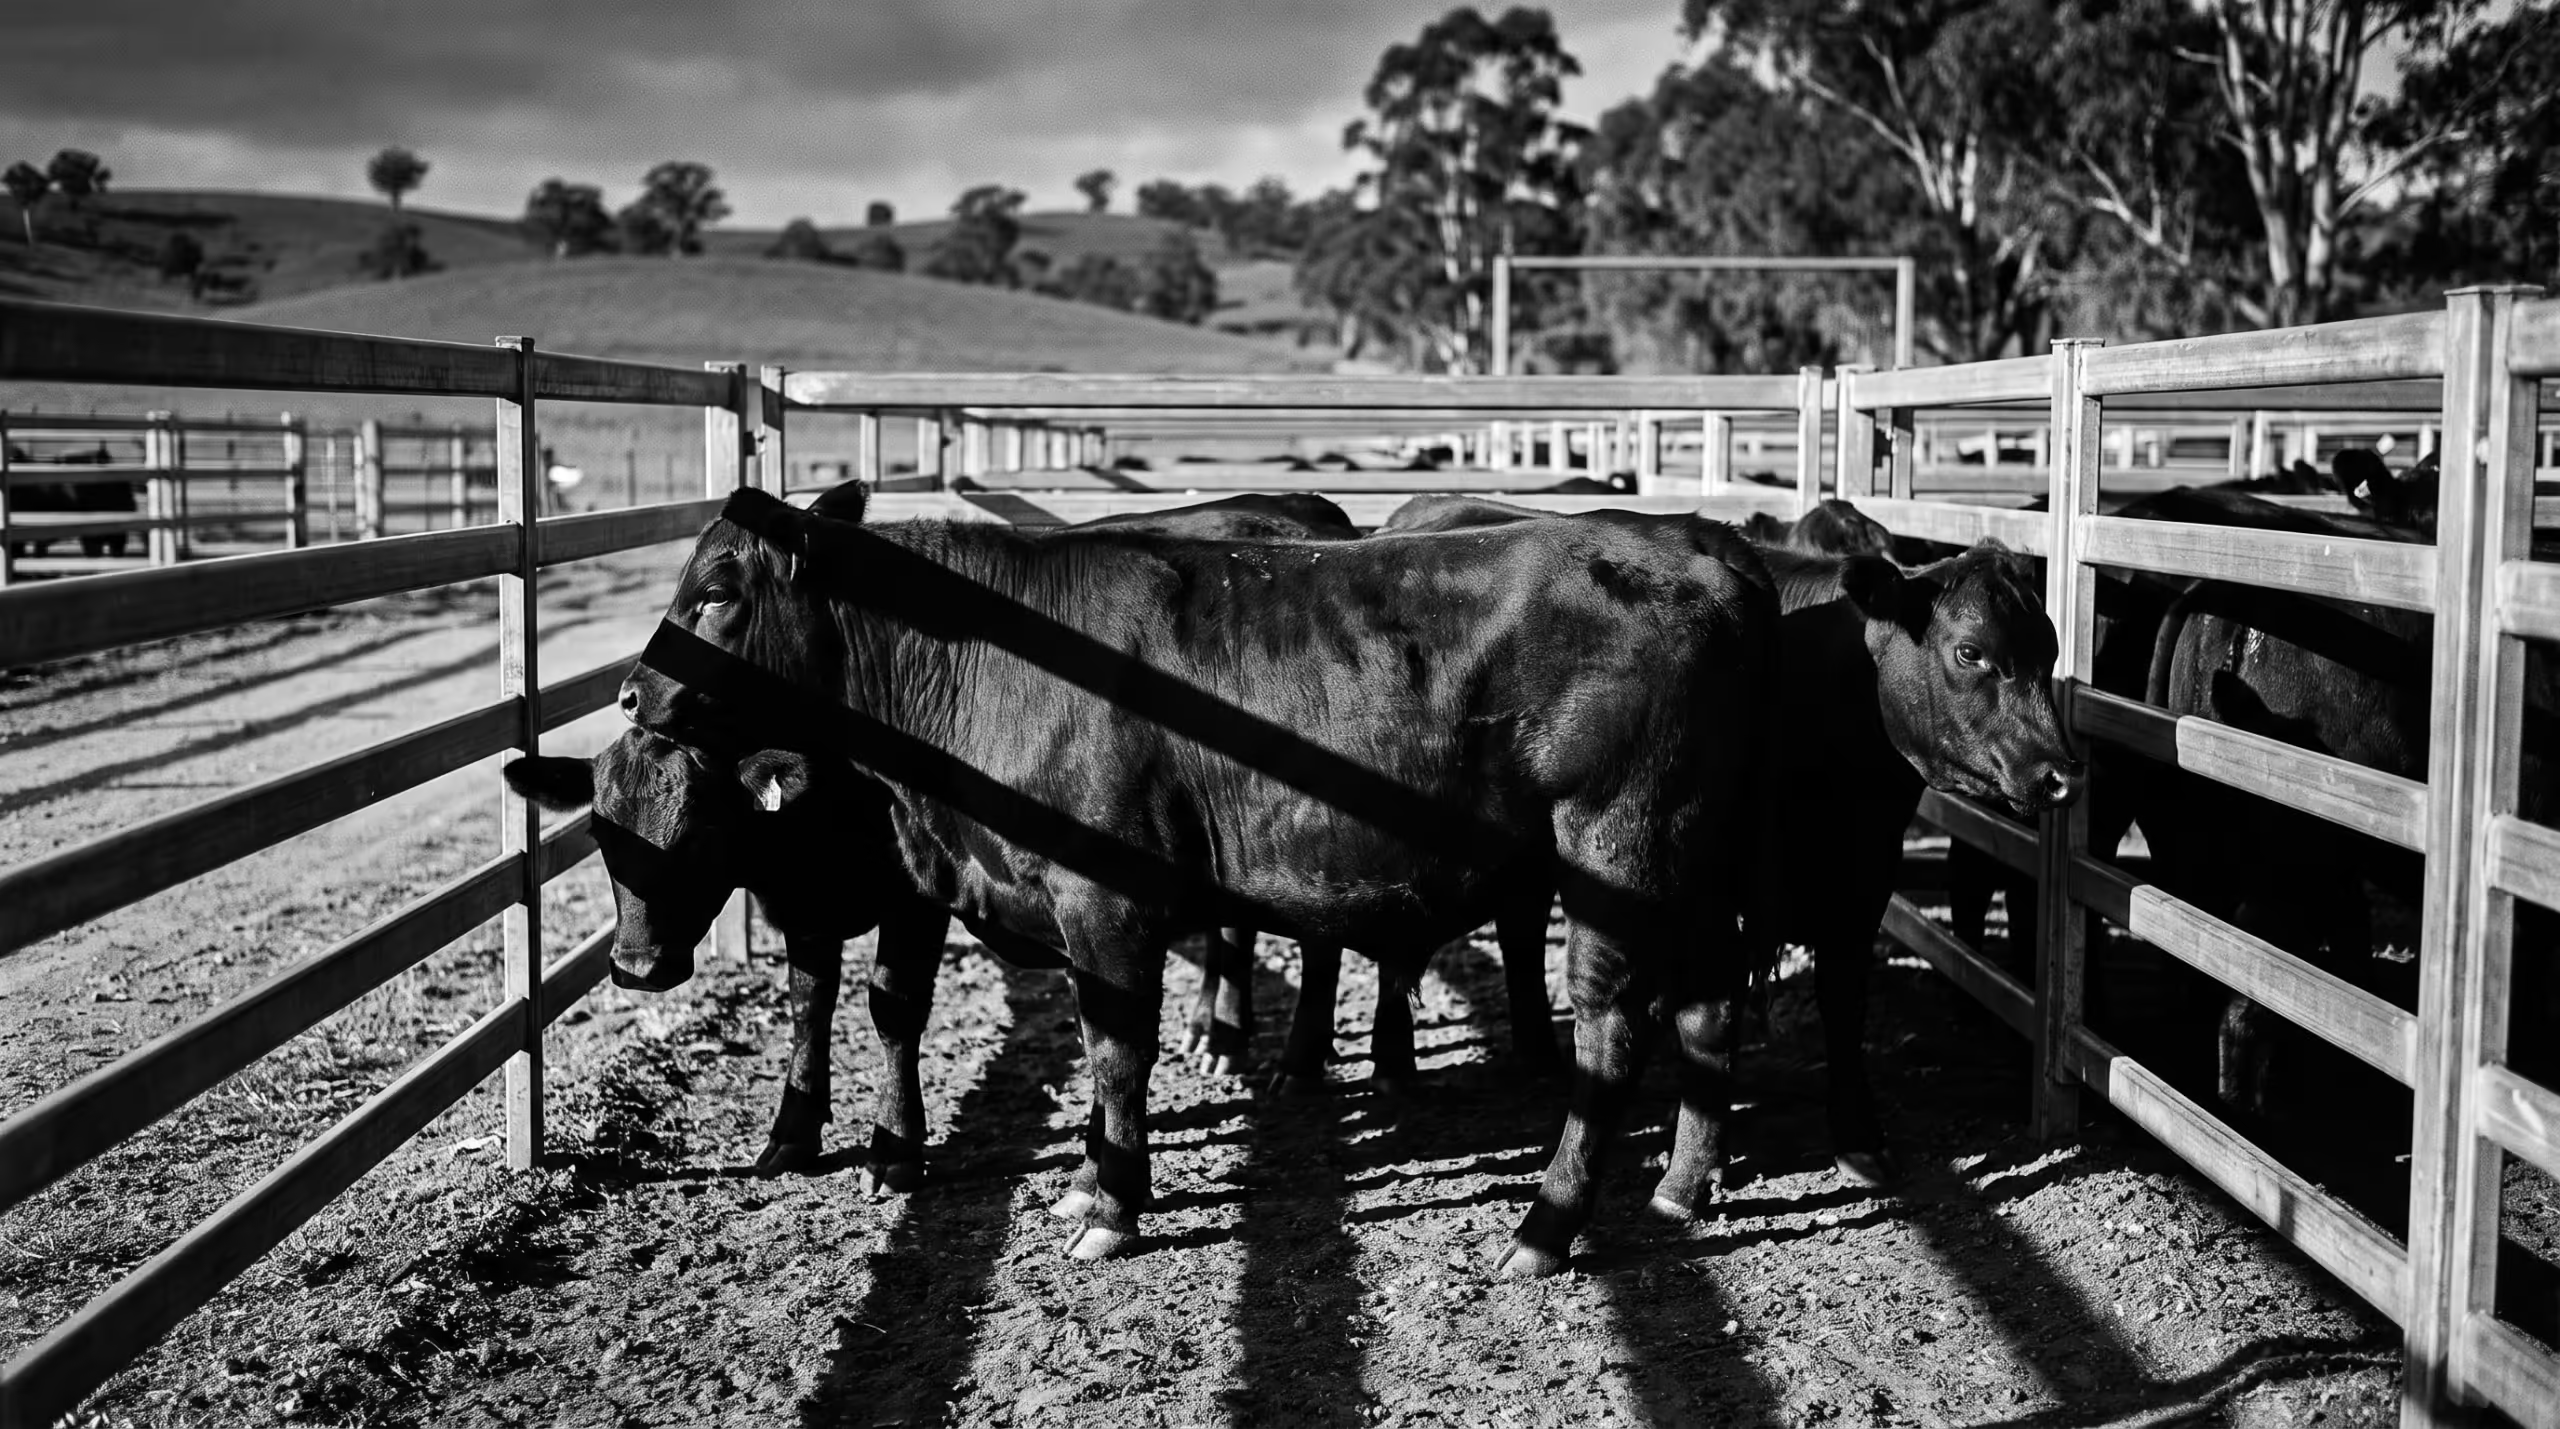

The Eastern Young Cattle Indicator, or EYCI, is the best known cattle price figure in Australia. It shows what young cattle sold for across the big eastern saleyards over the last seven days. Meat & Livestock Australia (MLA) works it out and quotes it in cents per kilogram of carcase weight. You use it to judge where the young cattle market sits and which way it is moving.
This guide explains what the EYCI measures, how MLA builds it, where it goes wrong, and how to use it when you buy or sell. It does not give you today’s figure. Prices change every sale day, so check the live number on the MLA prices and markets page before you act.
What the EYCI Measures
The EYCI tracks one group of cattle. It covers vealer and yearling steers and heifers. These are young cattle sold through physical saleyards in Queensland, New South Wales and Victoria.
Not every young beast counts. The MLA EYCI specification sets the rules. Cattle must weigh 200kg liveweight or more. They must also carry a C muscle score with a fat score of 2 or 3. In plain terms, these are well grown, moderately finished young cattle.
This mix matters. The EYCI blends several buyer types into one number:
- Restockers who buy light cattle to grow out on grass.
- Feedlots who buy feeder steers and heifers to grain finish.
- Processors who buy finished vealers and yearlings for slaughter.
Each of these buyers reacts to different things. Restockers follow rain and grass. Feedlots follow grain prices and export demand. Processors follow kill space and the beef price overseas. The EYCI rolls all of them into one figure.
Why it uses carcase weight
Saleyards sell cattle in cents per kilogram liveweight. The EYCI converts those prices to cents per kilogram carcase weight. MLA does this so light and heavy cattle sit on the same scale.
The carcase is the part left after slaughter and dressing. It weighs less than the live animal. So the carcase price per kilogram is always higher than the live price for the same beast. Keep this in mind when you hold your sale docket next to the EYCI. The two numbers measure different things.
How MLA Calculates the EYCI
MLA’s National Livestock Reporting Service (NLRS) sends reporters to each sale. They record every pen of eligible cattle. For each pen they note the head count, the average liveweight price and an estimated dressing percentage.
The calculation then runs in three steps:
- Convert each pen to carcase weight. MLA turns the liveweight price into a carcase price using the dressing percentage.
- Weight each pen by head count. A pen of 40 head counts four times as much as a pen of 10.
- Average across seven days. MLA adds up all the weighted pens and divides by the total head. The result is a seven day rolling average in cents per kilogram carcase weight.
Here is how the carcase step works. These are example figures only, not market prices. A steer makes 400c/kg liveweight. The reporter estimates a dressing percentage of 50%. Divide the live price by 0.50 and you get 800c/kg carcase weight. A lower dressing percentage gives a higher carcase price from the same live price.
Get the latest cattle market updates straight to your inbox. Subscribe free to the Cattle Weekly newsletter. Subscribe here.
Why the EYCI moves when prices do not
The EYCI weights each pen by the number of head. Big sales therefore pull the figure harder than small ones. One large Queensland sale with strong prices lifts the whole indicator. One large sale with weak prices drags it down.
The weight mix also shifts the number. Lighter cattle often dress lower and so carry a higher carcase price. If more light cattle come forward one week, the EYCI rises even when buyers pay the same as last week. Beef Central and other market writers have pointed to both effects over the years.
The seven day window adds a lag. A sharp fall on Monday shows up in pieces across the week. Your own sale result often moves before the EYCI does.
Where the EYCI Fits With Other Indicators
The EYCI is one of several MLA indicators. Each one tracks a narrower class of cattle. You get a clearer picture when you read them together.
| Indicator | What it tracks | Use it to |
|---|---|---|
| Eastern Young Cattle Indicator (EYCI) | Vealer and yearling steers and heifers, eastern saleyards | Read the overall mood of the young cattle trade |
| Restocker yearling steer indicator | Light store steers bought to grow out | Check grass and season driven demand |
| Feeder steer indicator | Steers bought for feedlot entry | Check feedlot demand and grain effects |
| Heavy steer indicator | Finished heavy steers sold to processors | Check processor and export demand |
| Online Young Cattle Indicator (OYCI) | Young cattle sold on AuctionsPlus | Compare online prices with the saleyard trade |
If the EYCI rises but the heavy steer indicator stalls, restockers and feedlots drive the lift. If all of them rise together, demand runs strong across the chain. Our guide on how cattle prices are set in Australia explains these buyer forces in more depth.
MLA also reports a Western Young Cattle Indicator for Western Australia. Producers in the west should watch it ahead of the EYCI. Our state by state cattle market report covers local differences each month.
What Drives the EYCI Up and Down
No single factor sets the EYCI. Several forces push on it at once. These are the ones to watch.
Rain and pasture
Rain is the biggest swing factor for young cattle. Good falls across Queensland and New South Wales send restockers to the saleyards with money to spend. They bid up light cattle and the EYCI climbs. Dry seasons do the reverse. Producers sell stock they cannot feed, yardings swell and prices fall. Check the Cattle Weekly seasonal outlook alongside the indicator.
Herd rebuild or herd sell off
When the national herd grows, producers hold females to breed. Fewer heifers reach the saleyards, and buyers compete harder for what comes. When the herd shrinks, more females go to slaughter. Supply rises and young cattle prices soften. ABARES publishes herd and slaughter forecasts in its agricultural commodities reports. Read them to judge where the cycle sits.
Grain prices and feedlot demand
Feedlots buy a large share of heavier young cattle. Cheap grain lets them pay more for feeders. Dear grain cuts their margin and their bids. A sharp rise in grain prices often shows up in the feeder steer indicator first, then in the EYCI.
Export demand and the dollar
Australia exports most of the beef it produces. Strong demand from markets such as the United States, Japan, Korea and China lifts what processors pay. A lower Australian dollar makes our beef cheaper overseas, which also supports prices. Our beef export market roundup tracks these markets each month.
How to Use the EYCI on Your Place
The EYCI is a guide, not a price list. Use it to frame decisions, then check the detail for your own cattle.
Benchmark your sale result
Convert your own result to carcase weight before you compare. Take your liveweight price and divide it by a fair dressing percentage for your cattle. Ask your agent for a realistic figure. Then compare against the EYCI for the same week. If you sit well under it, ask why. The answer might be weight, breed, condition, the sale you chose or poor presentation.
Read the trend, not the day
One week’s move tells you little. Look at the EYCI over the last two or three months. A steady climb with rising yardings points to firm demand. A fall with rising yardings points to supply pressure, often from dry weather. Plot it next to your own sale results each year to learn how your cattle track it.
Time store purchases
Restockers watch the EYCI closely. A high EYCI means you pay more to restock. Weigh the cost of store cattle against your feed supply and your likely sale price. Buying dear store cattle onto a short feed year leaves you exposed if the market turns.
Pick the right indicator for your cattle
If you sell heavy finished steers, the heavy steer indicator suits you better. If you sell weaners to restockers, watch the restocker indicator. Use the EYCI as the headline, and use the narrower indicators to price your own line.
Keep your paperwork ready
Price means nothing if your cattle cannot sell on the day. Every beast needs an NLIS device and a current National Vendor Declaration. Integrity Systems runs NLIS and the LPA program. Check your devices and your PIC details before sale week.
Limits of the EYCI
The EYCI has real weak points. Know them before you lean on it.
- It reflects the saleyard trade only. It leaves out paddock sales and direct sales to processors. A large share of cattle never pass through a saleyard.
- Big sales dominate. Head count weighting lets a few large yardings set the figure.
- The weight mix shifts. A change in the type of cattle offered moves the number without any change in demand.
- It lags. The seven day average smooths out sharp moves and reports them late.
- It mixes buyers. Restockers, feedlots and processors all feed into one figure, so it hides who drives the market.
None of this makes the EYCI useless. It stays the most quoted cattle price in the country, and buyers and agents watch it. Use it as one input. Pair it with your agent’s advice, the narrower indicators and your own sale history. For the wider picture, start with our Australian cattle market and prices guide.
Frequently Asked Questions
What is the EYCI price today?
The EYCI changes every sale day. Check the live figure on the MLA prices and markets page. MLA quotes it in cents per kilogram carcase weight.
How is the EYCI calculated?
MLA records every pen of eligible young cattle at reported eastern saleyards. It converts each pen price to carcase weight, weights it by head count, and averages the result over seven days.
What cattle are included in the EYCI?
Vealer and yearling steers and heifers of 200kg liveweight or more, with a C muscle score and fat score 2 or 3. They must sell through reported saleyards in Queensland, New South Wales or Victoria.
Why is the EYCI quoted in carcase weight?
Carcase weight puts light and heavy cattle on the same scale. It also means the EYCI sits well above the liveweight price on your sale docket, so convert before you compare.
Does the EYCI include AuctionsPlus sales?
MLA reports online young cattle prices through a separate Online Young Cattle Indicator built from AuctionsPlus data. Check the MLA indicator specification for the current list of saleyards in the EYCI.